Create a shared understanding of key facts and insights.
Establishing a shared understanding of users, their priorities, and how your organisation could or does help them achieve their goals can be challenging. Trying to do this across large and distributed teams can be even more challenging.
Developing outputs such as service blueprints, affinity maps, empathy maps, journey maps, experience maps, and roadmaps can help address this challenge by visualising insights effectively.
Trusted by





What is journey and empathy mapping?
A map is a visualisation tool that can be used to communicate key information about a user, group of users, a journey, a process, a roadmap, or lifecycle. They are primarily used to communicate what people are likely to value and how an organisation does or could provide this when people interact with them.
By their nature maps are reductive. Rather than communicating each and every detail gathered throughout the research process, they visualise the most important insights and data.
There are numerous types of maps that can be used to visualise research findings. Each of these has its own purpose and focus. Depending on the purpose, focus, and scope of the insights you wish to share, one or more of the following should be considered:
- Stakeholder map
- Affinity maps
- Scenario maps
- Empathy maps
- Journey maps
- Experience maps
- Service blueprints
- Process maps
- Ecosystem maps
- Roadmaps
As the focus and therefore the content of each of the above is different, it’s highly likely that more than one type of map will be produced throughout a user centred design and development process. Ultimately, selecting which type of map to use should be driven by the purpose of the output, and what insights are available to be shared.
Key benefits of journey and empathy mapping
Ensure key facts and insights are communicated effectively.
Establish a shared understanding of key information.
Stimulate discussion, collaboration, and alignment.
What do I get?
- Core deliverable. Please note the type of map to be delivered is dependent on the purpose of the deliverable, specific research conducted, and insights to be visualised/output(s) selected
- Core deliverable template
- Presentation of map slide deck
- Design brief for core deliverable
- Research brief and topic guides
- Overview of key findings
- Research log
- Project plan and schedule
- Risk register
Fees
Visualisation services start from £5,000.
Research and analysis are dependent on the scope.
Timeline
The average turnaround time for:
- Visualisation services are 2 weeks
- Research and analysis are dependent on the methods selected.
What our clients think
“Border Crossing UX get right inside the mind-set of your clients and work with utter dedication to deliver the results your business needs.”
“Border Crossing UX helped us define how micro-businesses perceive and interact with our services. Coming highly recommended, their professionalism and thoroughness was fantastic.”
“Border Crossing UX provided the expertise and support the National Galleries of Scotland needed and have become a trusted supplier.”
“NHS 24 needed to complete a product deep dive which covered a number of areas. I cannot recommend them enough to anyone considering how to drive forward their digital ambitions and develop greater user insight across their digital estate and transformation strategies.”
Want to work with us too?
Discuss your specific requirements with a user experience specialist.
How do you approach journey and empathy mapping?
Over the last 10 years, we’ve worked on a broad range of visualisations that detail research insights. Our user centred approach ensures we:
1. Define objectives, priorities, and constraints
- Define the purpose of the deliverable
- Identify key stakeholders, their roles, and goals for the deliverable
- Define what sources and inputs will inform the deliverable
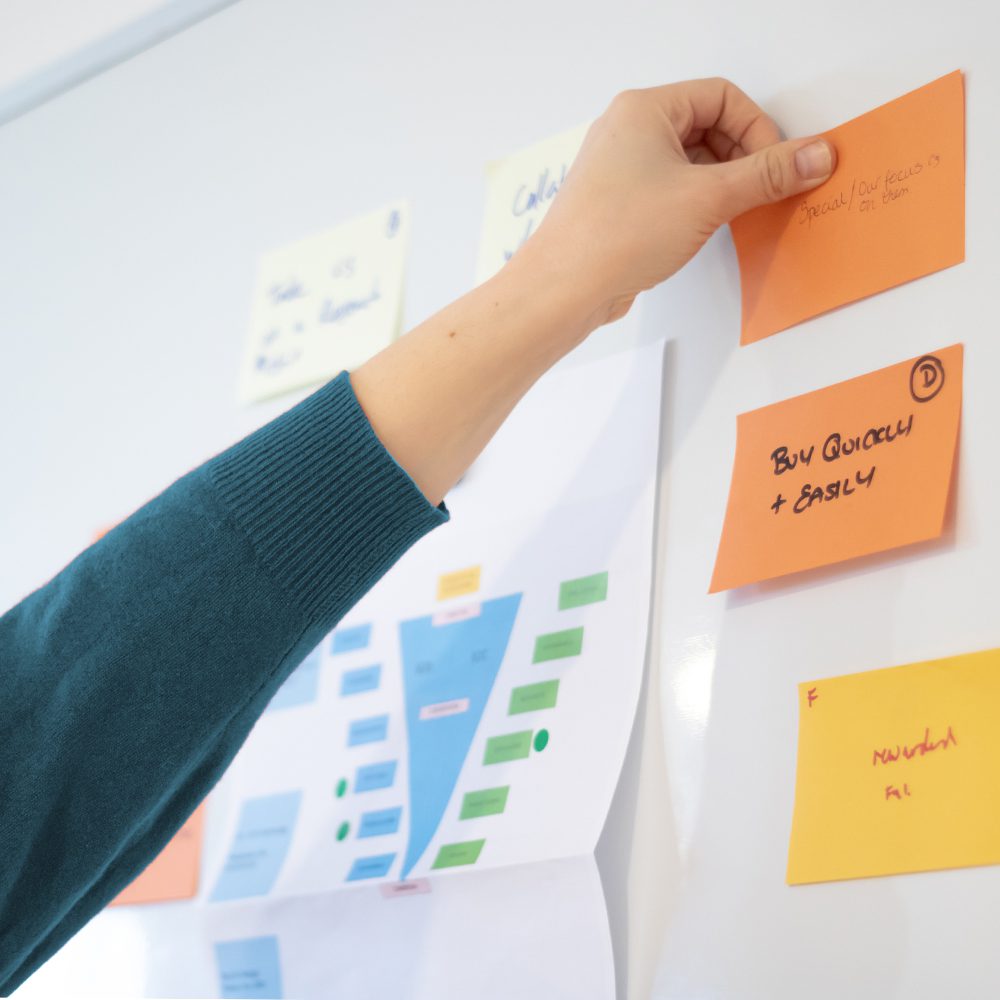



2. Aggregate and synthesise
- Analyse existing data and insights
- Define insights that could be visualised
- Collaborate on synthesising and prioritising insights to be visualised
3. Conduct primary and secondary research
- Identify knowledge gaps
- Define how to fill knowledge gaps and/or test assumptions
- Conduct primary and secondary research
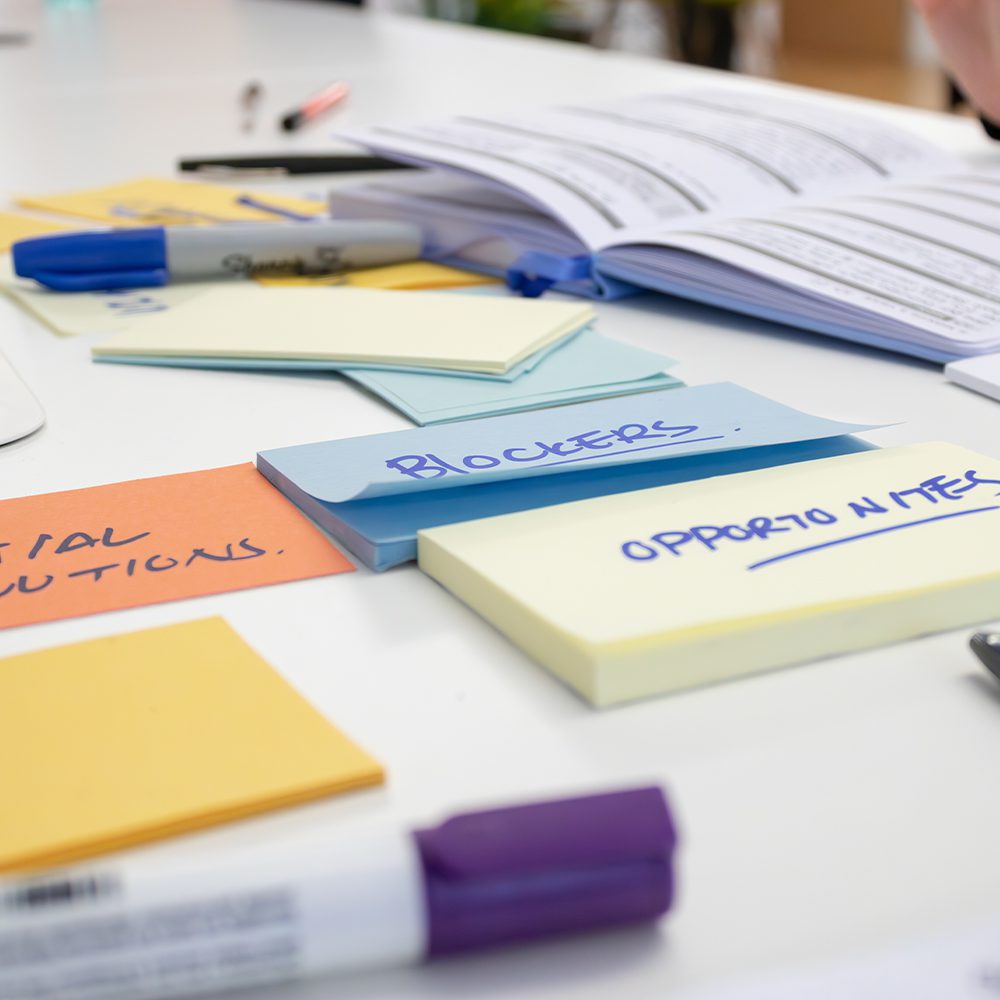


4. Analyse, design and test
- Analyse findings and define relevant insights
- Design and populate the draft deliverable
- Test the deliverable
5. Share, refine, and support
- Present and share the deliverable
- Refine the deliverable
- Provide on-going support


Visualising user research insights will help you and your team align on what you are focussing on, and why.
Want to identify and visualise insights?
Discuss your specific requirements with a user experience specialist.